
Reporting Pages: From Numbers to Answers to Actions
Reporting Pages are dashboards that AI agents build for one use case: they give a final answer, show the root cause and recommend the next action. Why we built our own instead of relying on AI artifacts or our BI tool, how they sit on our semantic layer and reporting-mcp, why AI is paid for once instead of on every view, and what two months in production look like.
What Reporting Pages are
Classic reporting gives teams numbers and leaves the rest to the reader: is this good or bad, why did it happen, and what should we do about it?
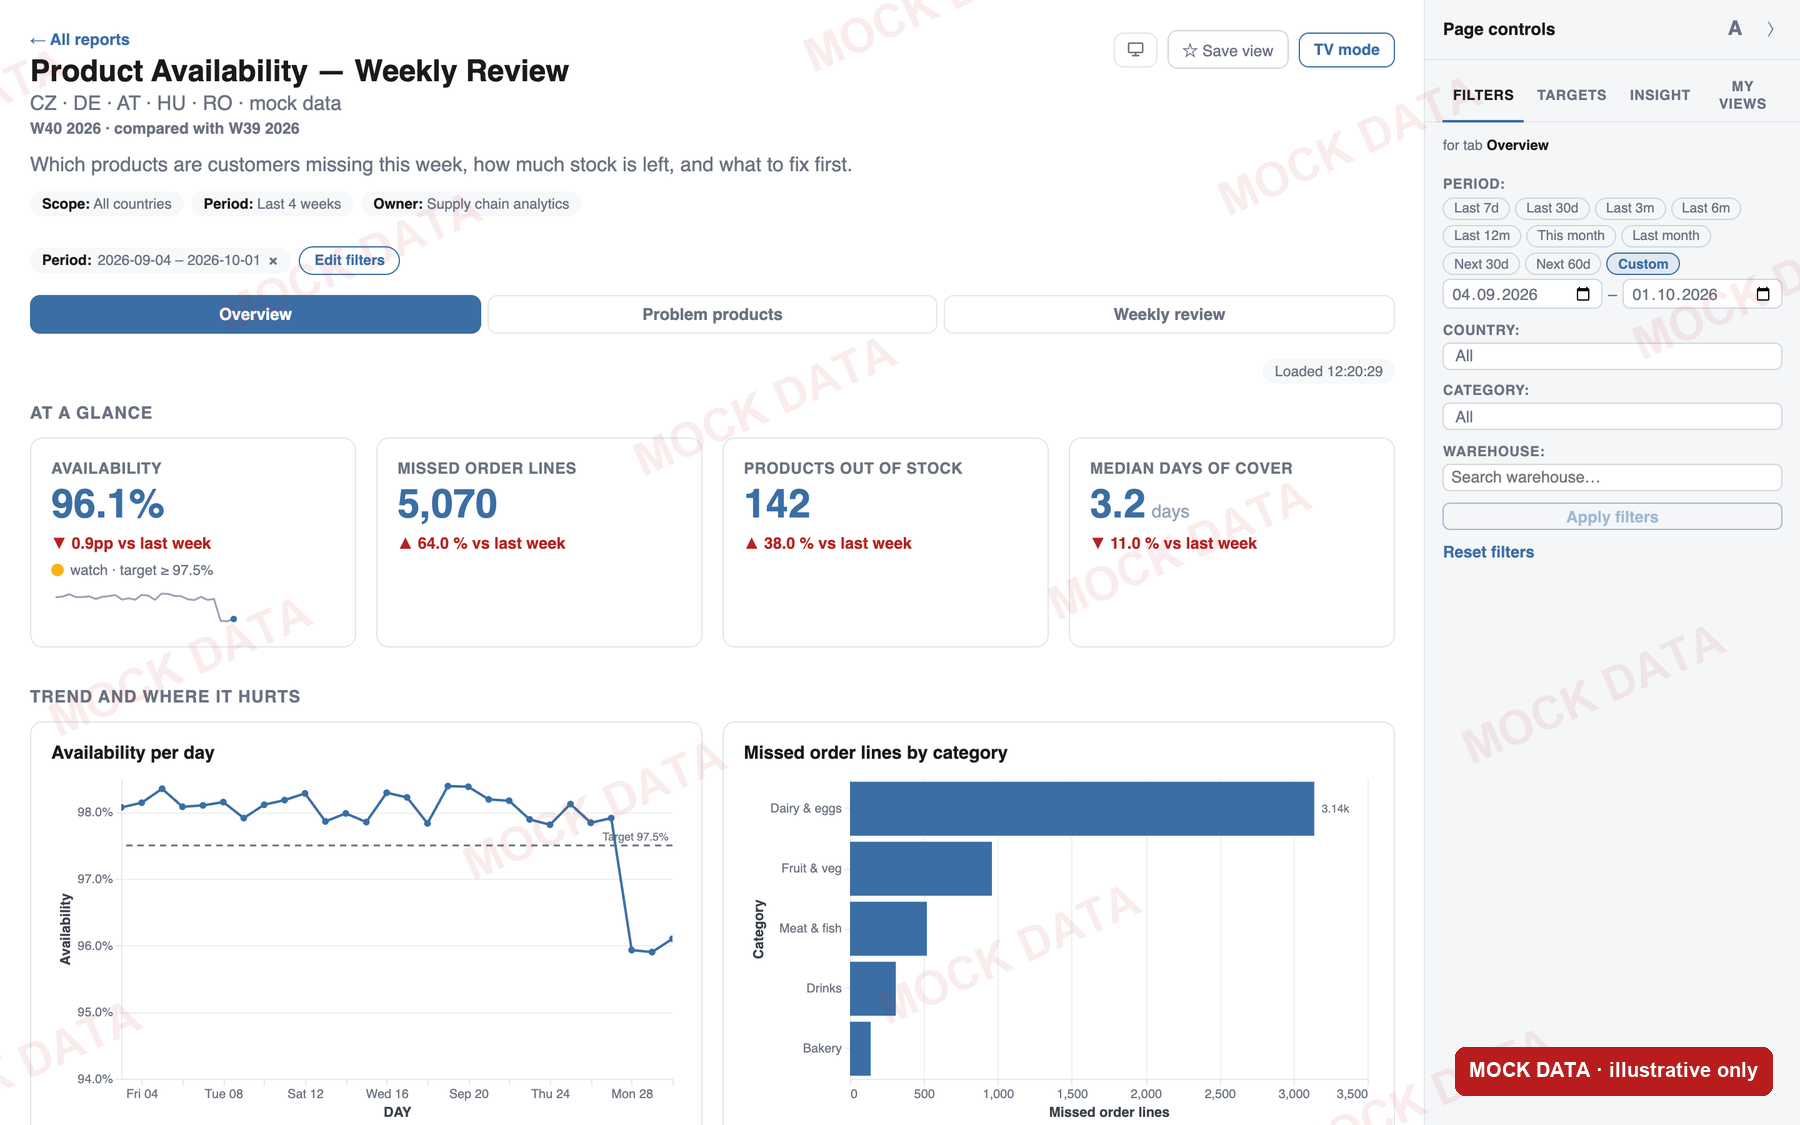
Reporting Pages go further. A Reporting Page is a dashboard that an AI agent builds for one specific use case, served live from our data warehouse. It is built around the question a team actually asks, not around a generic data model. It gives a final answer, with KPIs, targets and traffic-light colours that show at a glance whether we are on track. Every problem row says why it happened. And each problem comes with a recommended action from a fixed list: create a purchase order, switch to a backup supplier, update the forecast, reduce write-offs, or just monitor.
Here is what that looks like on a product availability page. All screenshots in this post use mock data.
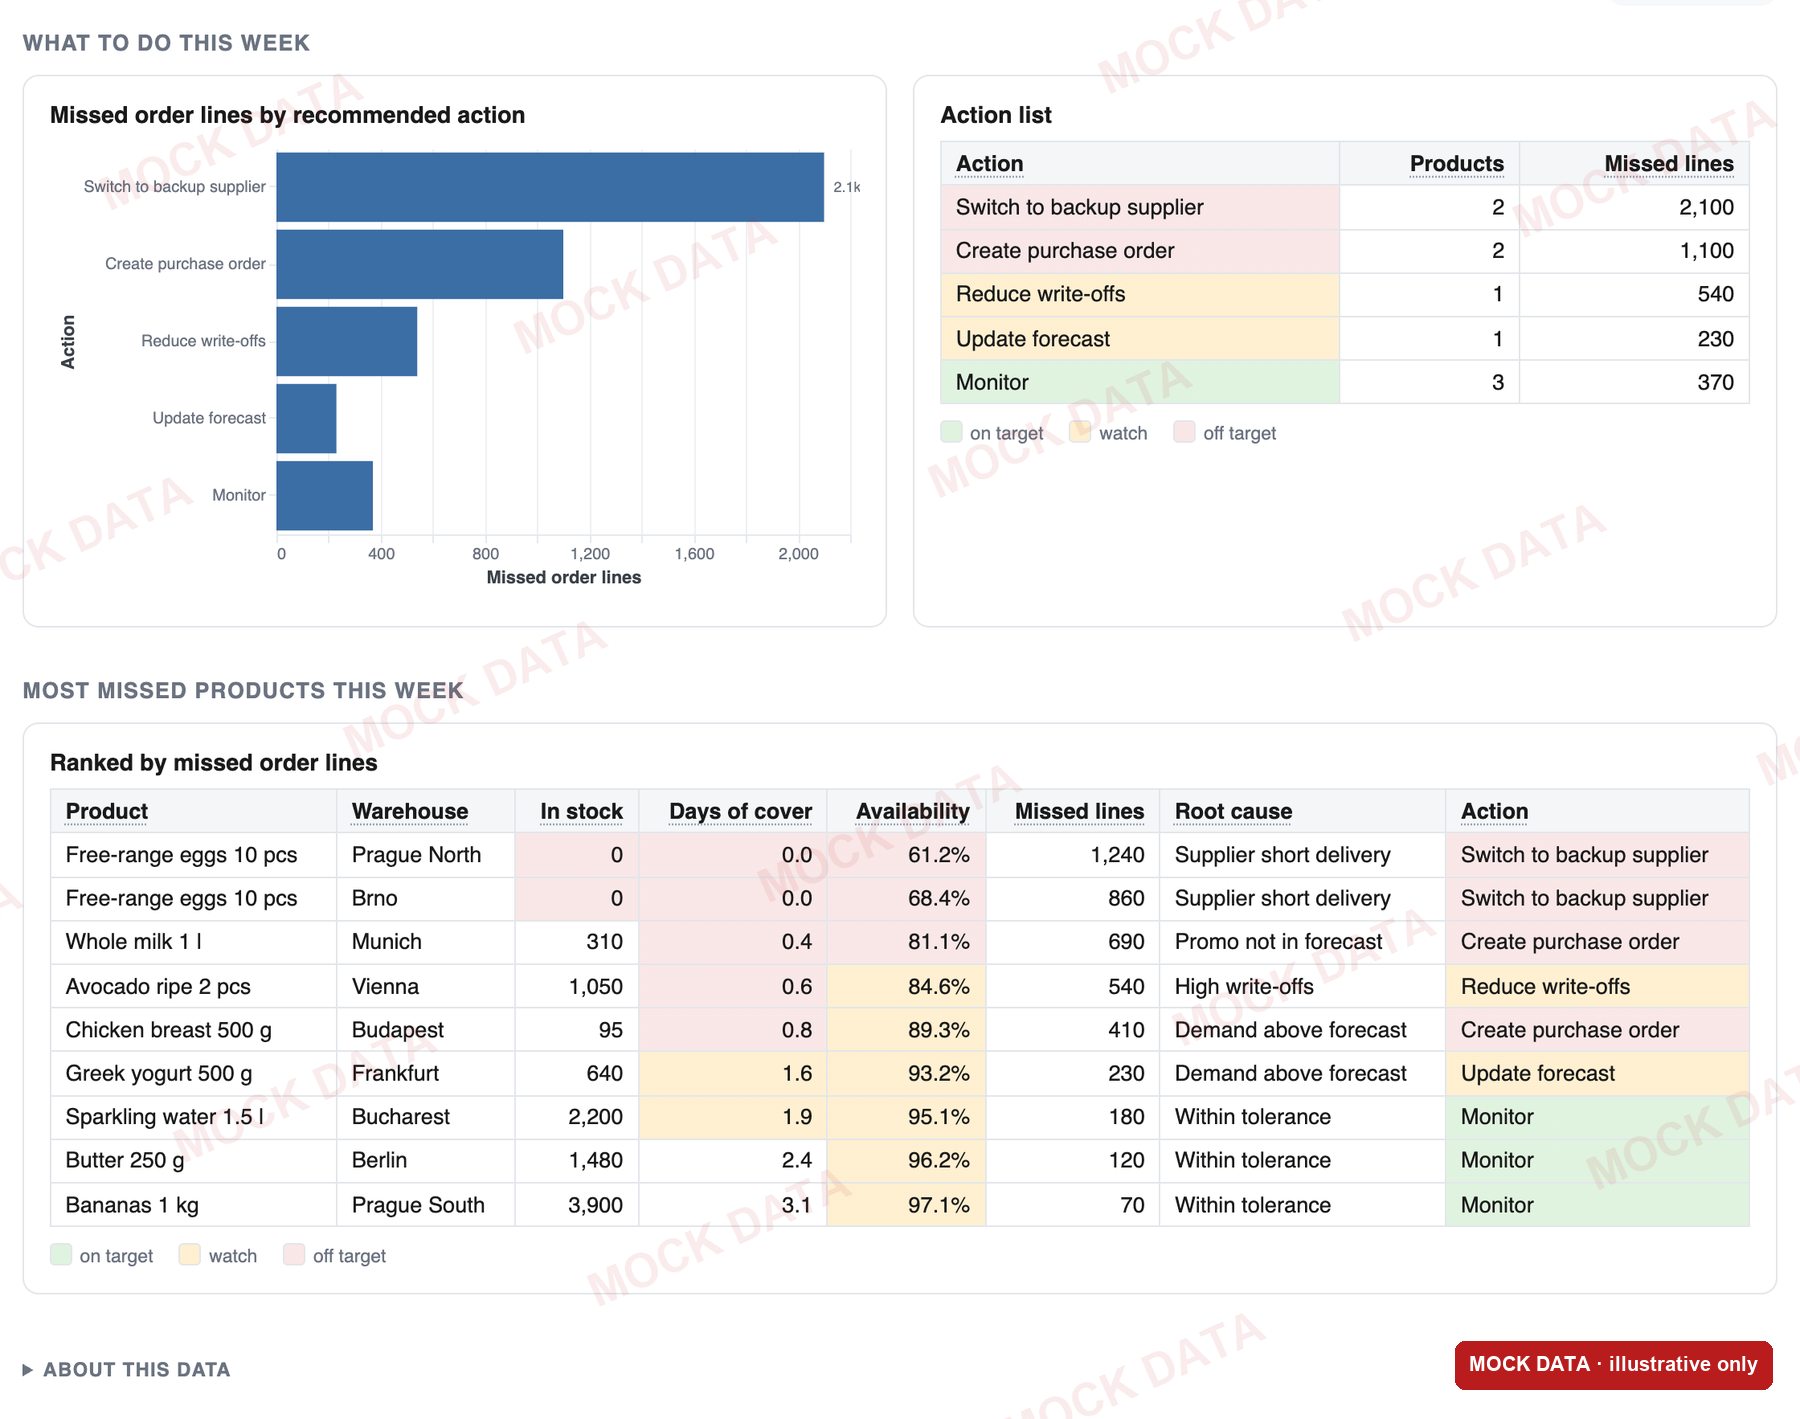
Reporting Pages have been in production for two months, and we are moving our company reporting to them.
Why we built it
We do have a classic BI tool (Tableau), AI chat over the warehouse, and AI-generated dashboards. Each solved part of the problem, and none of them solved it in full.
| Classic BI tool | AI chat only | AI artifact | Reporting Page | |
|---|---|---|---|---|
| New report | Days, built by hand in an editor | Seconds, but only for you | Minutes, but only for you | Minutes, shared with everyone |
| Same answer every time | Yes | No, new SQL for every question | No, new code every time | Yes, one fixed query |
| Data freshness | Often extracts on a schedule | Live | Snapshot copied into the page | Live on every open |
| Traceability | Logic hidden in calculated fields | Lost in chat history | Hidden in generated code | Named, readable queries in the warehouse |
| Data leaving the platform | CSV and Excel downloads | Answers copied around | Data travels with the file | Stays in the warehouse |
| Answer and action | Numbers; interpretation is up to you | Yes, but not shared | Static | Built into the page |
| Cost | Licence per seat | AI and warehouse cost per question | Low, but goes stale | Query reused, AI only on demand |
Why not just AI artifacts?
This is the question we hear most, because many of our first AI-built dashboards were exactly that: AI artifacts (Claude), one-off HTML pages generated in a chat with an AI assistant. They look great and are perfect for quick exploration. But an artifact is a file. Its numbers are a snapshot copied into the page, its logic is hidden in generated code, and it lives on a third-party platform, in someone's personal chat.
So we built our own lane instead. The agent does not hand us an HTML file. It publishes through reporting-mcp, our own gateway, which stores the page definition in our own cloud storage and the data as named views in our own warehouse. Nothing lives outside our infrastructure, everyone opens the same page, and nothing ever has to be regenerated to show fresh numbers.
Where the money goes
Today almost everything with AI in it has a price tag, and it adds up quickly. That is the other half of the reason.
With AI alone, every question means new AI work and a new warehouse query, often for the same question asked again and again. An artifact has to be regenerated, with all its tokens, every time someone wants fresh numbers. A classic BI tool charges a licence seat for every viewer.
Reporting Pages pay for AI once: when a page is created or changed. After that, every view is one query on a small warehouse, often answered from the warehouse's own result cache. AI cost comes back only when someone asks the Insight analyst a question.
| AI cost | Cost of every view | |
|---|---|---|
| AI chat only | Every question | A new warehouse query |
| AI artifact | Every refresh (regenerate) | None, but the data is stale |
| Classic BI tool | None | A licence seat per viewer |
| Reporting Page | Once, when the page is created or changed; Insight on demand | One small, reused query |
Why we are making the switch
Put together, that is why we are moving our reporting to Reporting Pages:
- Answers instead of numbers. Every page ends in a decision: on track or not, why, and what to do
- Trust. The same reviewed query every time, live data and a clear trace behind every number
- Control. No CSV or Excel exports, no shadow spreadsheets, one governed place for company numbers
- Speed. A new report takes minutes instead of days, with no reporting queue
- Cost. AI is paid for once, queries are reused, and there is no licence seat per viewer
- No lock-in to one AI provider. Pages are built through an open tool interface, so Claude, ChatGPT, Gemini or local models can all create and update them the same way
- A path to automation. Fixed root causes and fixed actions are exactly what agents need to act on their own
How it fits together: the semantic layer and reporting-mcp
Reporting Pages do not start from scratch. They sit on top of the two pieces from our previous data post.
The semantic layer lives in Git: approved metric definitions, verified queries, and table and column descriptions. That is where our business logic lives, and it is reviewed like code. reporting-mcp is the gateway AI agents use to reach the warehouse. Agents search the semantic layer first, so they start from approved metrics and verified queries instead of guessing.
Publishing a page is one more tool in that same gateway. The agent saves each dataset as a named view in the warehouse and the page definition next to it, then gets a shareable link back. When someone opens the link, the Reporting Pages app reads the definition, queries those views live and renders the page. It can only read the page's own views. The Insight analyst in the sidebar runs on Sandstorm, our internal agent platform, and answers follow-up questions through the same gateway.
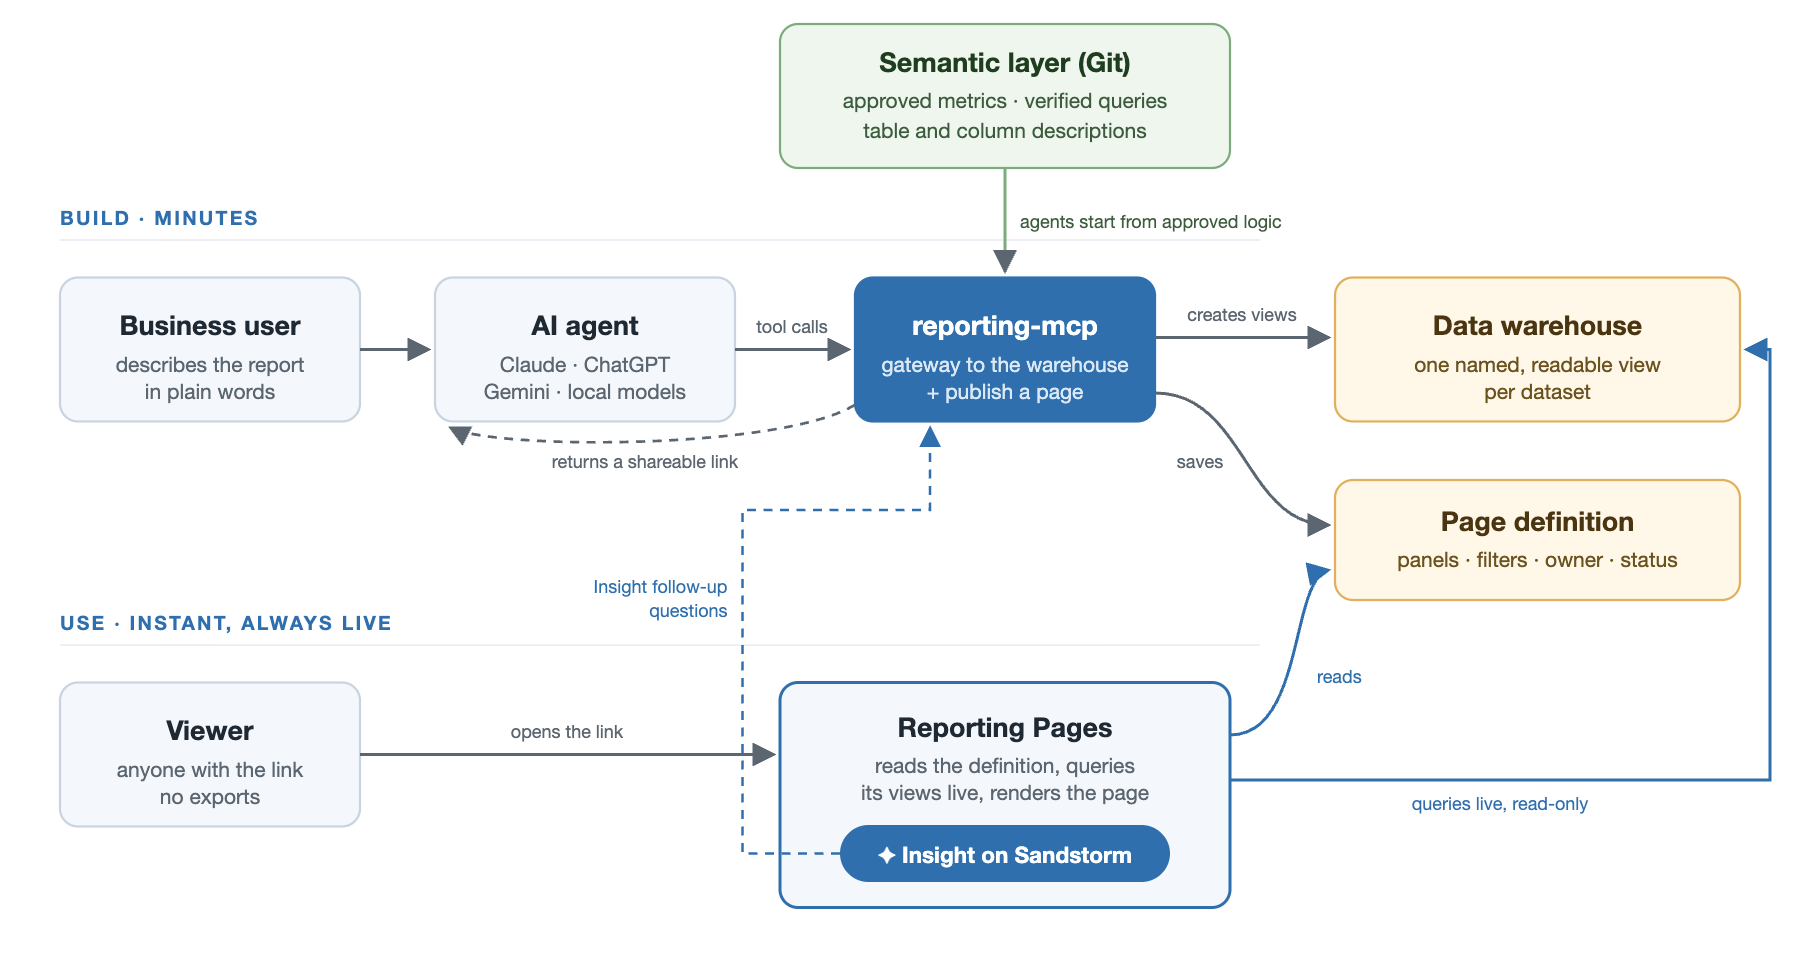
The result: every number on a page traces back to the same approved definitions that agents use when you ask them in a chat.
How a page is made
- Someone describes the report in plain words, for example "products customers are missing this week, per warehouse, with stock, days of cover, the root cause and a recommended action".
- An AI agent, from any provider, turns it into a short page definition: datasets, KPI tiles, charts, tables and filters. This takes minutes, and the agent returns a shareable link.
- The platform renders the page immediately every time someone opens that link.
- Changes work the same way ("add a weekly view by category"), and the link stays the same.
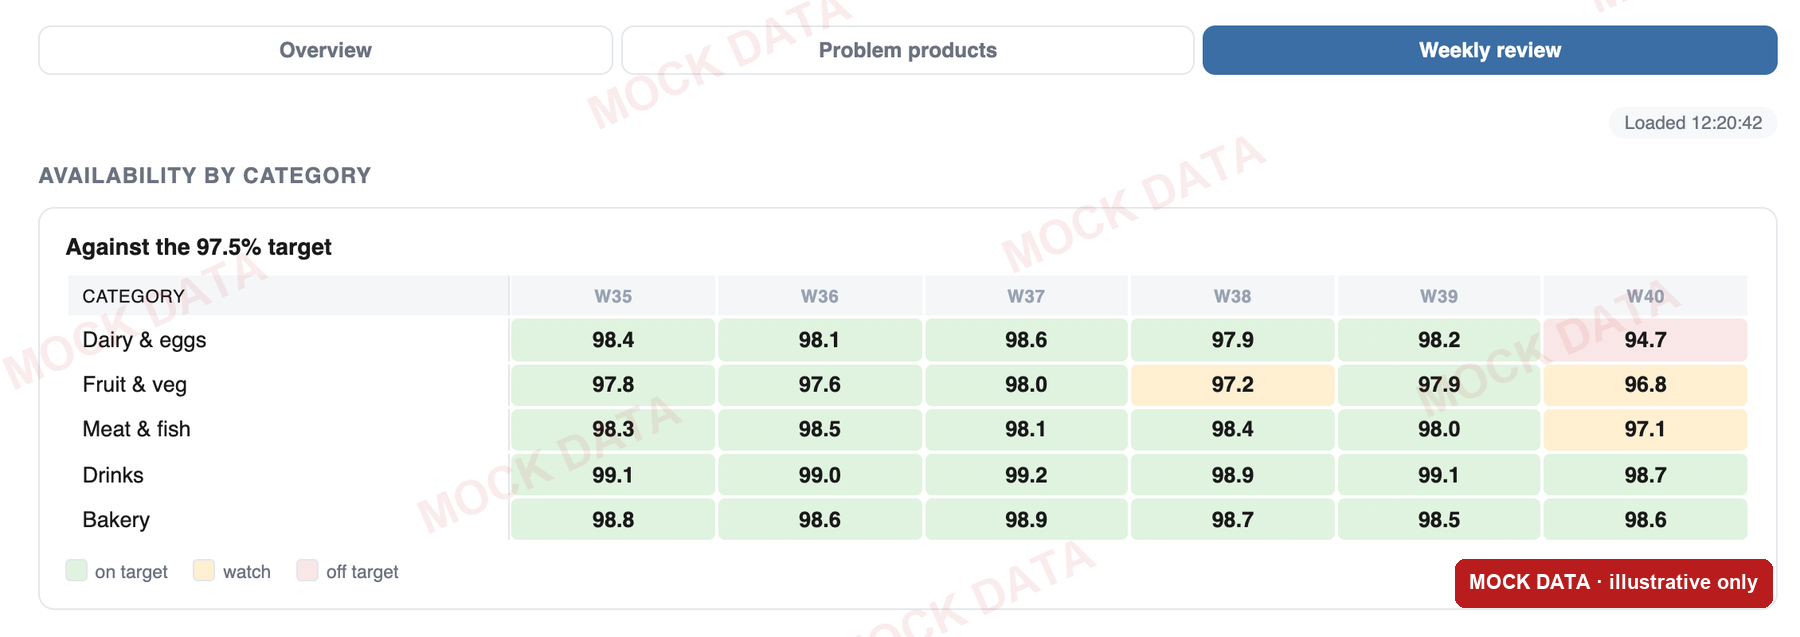
There is no dragging fields around in an editor, and no ticket waiting in a queue. The page at the top of this post is a typical result: KPI tiles against target, the daily trend, where it hurts by category, and filters on the right.
What keeps it trustworthy
The same query every time
Each number comes from one fixed, reviewed query stored in the warehouse. Everyone who opens the page gets the same definition, so no AI improvises different SQL for each question. When a number changes, the data changed, not the method. That is the basis of data quality.
Live data, every time you open it
Every page view queries the warehouse directly. There are no extracts, no refresh schedules and no "data as of last night", unless the source itself is daily.
No black boxes
Every panel points to a named query in the warehouse that anyone in data can open and read. Every page has an owner and a status: Private while it is work in progress, Public, or Certified once data engineering has reviewed it. Every query is tagged and logged, so we know which pages are used and how often.
No CSV or Excel exports, on purpose
There is no download button. The numbers stay in one governed place: no stale copies in mailboxes, no ten versions of the same KPI in ten spreadsheets, and no sensitive data sitting on laptops. If someone needs a different cut, they change a filter, ask the AI analyst, or ask an agent to add a view, and the page improves for everyone.
Insight: an AI analyst on every page
Insight is a private AI chat in the page sidebar. It runs on Sandstorm, in a fresh, isolated sandbox for every request.
It starts from what you are looking at: the page, the active tab, the applied filters and the rows on screen. Follow-up questions can go beyond the page and query the data warehouse for the detail behind a number. It explains the root cause and maps it to the same action list the page uses. The conversation lives only in the browser and disappears when you leave the page, and every answer carries a note: AI-generated, verify before acting.
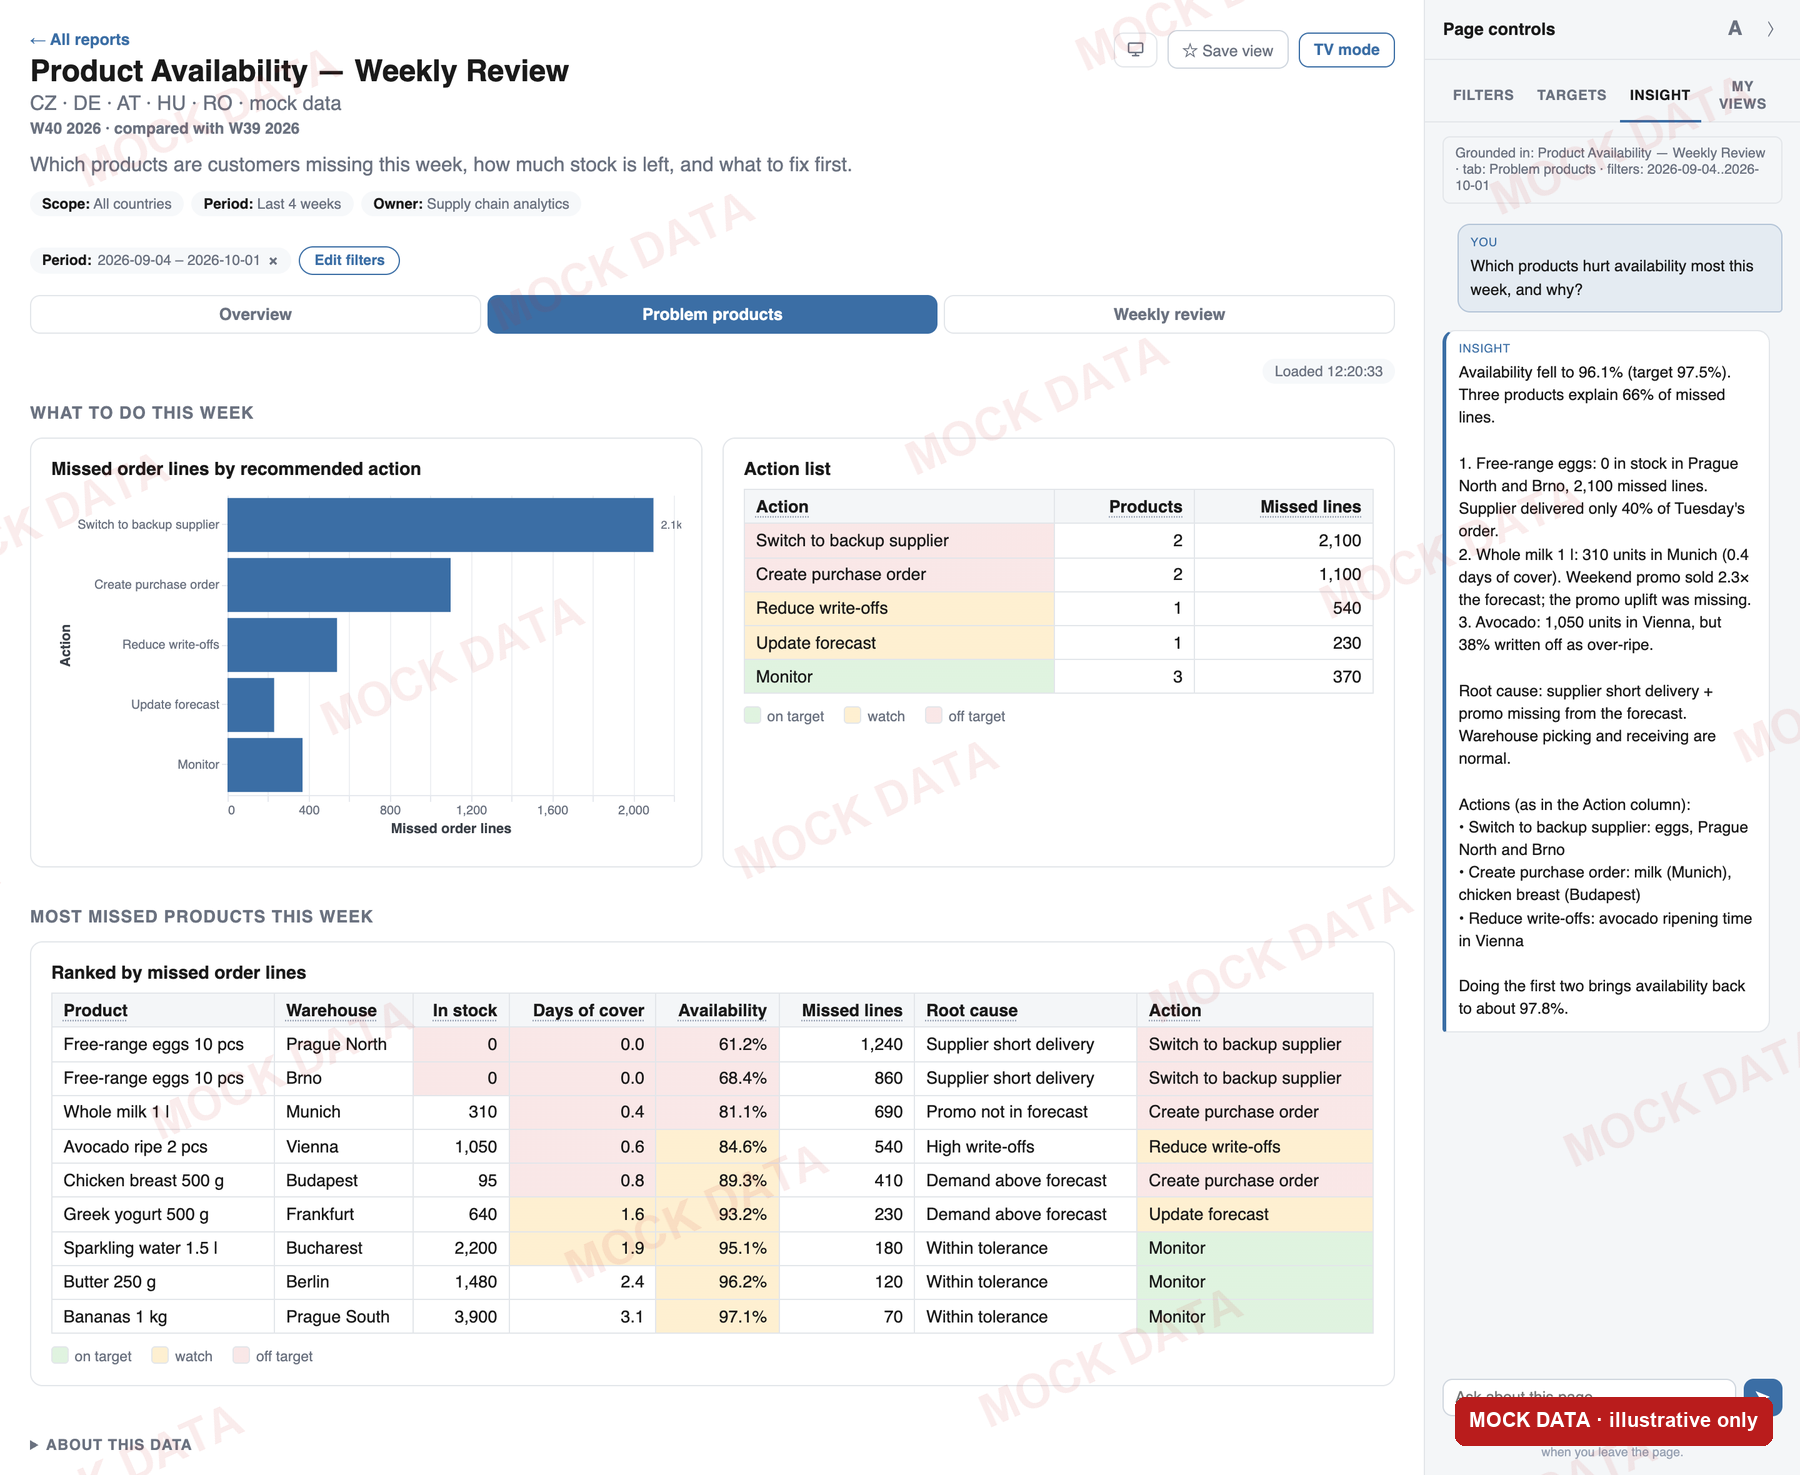
The page answers what and what to do. Insight explains why.
Two months in production
Since mid-August, agents have created over 400 warehouse datasets behind reporting pages, more than 340 of them in the last 30 days. Migration from our classic BI tool is under way, and each page is checked metric by metric and filter by filter against the report it replaces. New capabilities ship every week: breakdown and pivot tables, fiscal-year views, targets with traffic-light colours, saved views and a TV mode for wall screens.
Challenges
- A change of habits. People used to exporting data into their own spreadsheet now ask for the view they need instead
- Fast publishing needs discipline. Drafts pile up, and certification only means something because data engineering really reviews it
- We build and run it ourselves. There is no vendor support to call: keeping it running, fixing bugs and adding features is on our team
- AI answers need judgement. Insight is a strong first analyst, not the final one
What's next
We want richer visuals: more chart types, flexible layouts and drill-through from a chart into a filtered detail page, plus a real map with data on top. We want more teams authoring pages, not only data engineering, and per-user data security end to end, so that warehouse permissions follow the viewer into the page.
The biggest step is closing the loop. Because root causes and actions are a fixed list, agents can start carrying out the recommended actions themselves, with a person approving.
The bottom line
Reporting Pages move reporting from "here are the numbers" to "here is the answer, here is why, and here is what to do". The same query every time, live data, a trace behind every number, nothing exported, and AI paid for once instead of on every view. That is why we built it, and why we see it as the step right before full automation.
If you are working on similar problems, we would love to compare notes.