Threads Monitoring: MySQL Deep Observability for Cloud SQL
CloudSQL for MySQL gives you CPU graphs and connection counts. When something goes wrong you need to know which exact query ran for 3 seconds at 14:07:43, which user triggered it, and which threads were competing for locks. Threads Monitoring captures every query from performance_schema as it executes, with no agents and no schema changes, and produces two self-contained HTML reports for immediate investigation.

Why Threads Monitoring?
CloudSQL for MySQL gives you CPU graphs and connection counts — sampled, basic, not enough. When something goes wrong you need to know which exact query ran for 3 seconds at 14:07:43, which user triggered it, whether it used an index, and how many threads were competing for locks at that moment. Threads Monitoring captures every query from performance_schema as it executes — no agents, no schema changes, no server-side installation — and produces two self-contained HTML reports for immediate investigation. Works out of the box with GCP Cloud SQL.
The Capture — The Most Critical Part
Before any report exists, Threads Monitoring has to continuously scrape the database — polling every active query, every thread, every few seconds — without disturbing the production workload. This is the hardest part to get right.
Why this matters:
- A poorly written capture tool can become its own source of load — extra connections, heavy queries, lock pressure
- On a busy production instance, even a small overhead compounds fast
- The capture must be precise enough to miss nothing, yet light enough to be invisible
Why Rust:
- Zero garbage collector pauses — polling intervals stay tight and predictable
- Memory-efficient by design — no hidden allocations between polls
- Compiled, fast, and deterministic under load
How Threads Monitoring behaves on your server:
- Single persistent read-only connection — not a pool
- Queries only
performance_schemain-memory tables — no I/O cost on the server - Session variables set to suppress slow-query logging and binary log entries
- Adaptive polling — backs off automatically if the server is under pressure
The result: the tool runs comfortably alongside a 78K-QPS production instance without registering as noise.
Timeline — Graphical View of Database Activity
Every database thread gets a horizontal swimlane. Every query execution appears as a dot or bar at the exact time it ran — colour-coded by statement type. Zoom from 30 seconds to the full capture length.
What you can spot immediately:
- A thread stalling while all others move freely → lock contention
- A burst of queries at a specific timestamp → application event or job trigger
- One thread doing nothing for 10 seconds then a flood of work → queue buildup
- Queries that look fast individually but fire in tight loops → N+1 problem
Navigation:
- Zoom presets: 30s / 1m / 2m / 5m / 15m / 1h / All
- Minimap for global density overview
- Shift+drag any window → instant breakdown of event count, type mix, total wait time
- Filter by statement type or user
Analytics Report
Aggregated insight across the entire capture — which queries cost the most, who causes the most load, where indexes are missing.
What you can answer:
- Which 5 query patterns consume 80% of total server time?
- Which users run the heaviest workloads?
- Which queries do full table scans?
- What does the latency distribution look like — is the p99 an outlier or a pattern?
- Are there lock wait storms? Disk temp table spills?
What's inside:
| Section | Question It Answers |
|---|---|
| Overview cards | Scale of the capture at a glance |
| Top queries by server time | Where the money is being spent |
| Most frequent queries | What's hammering the server |
| Full scans without index | Easiest optimization wins |
| Lock contention | What's blocking what |
| Latency histogram + percentiles | p50 / p75 / p90 / p95 / p99 |
| User × Statement type matrix | Who does what, in heat-map form |
| Slowest individual executions | Worst single outliers |
| Temp table + heavy row scan analysis | Hidden cost patterns |
| Query rate over time | Load shape across the capture window |
What It Is Good For
- Incident investigation — capture during a slowdown, replay the timeline, find the exact moment and query
- Query optimization — identify which patterns cost the most in aggregate, not just which ones look slow in isolation
- Missing index discovery — full-scan detection flags queries that bypass indexes entirely
- User behavior analysis — understand who runs what and at what volume
- Lock diagnosis — see which threads wait and which threads hold
- Capacity planning — sustained query rate, latency percentiles, DML volume in one report
What It Is Not
- Not an APM agent or always-on monitor
- Not a slow query log parser (it sees fast queries too — the ones that add up)
- Not a general-purpose dashboarding tool
- Does not modify your database in any way
Part 2 — Technical Dive
Pipeline
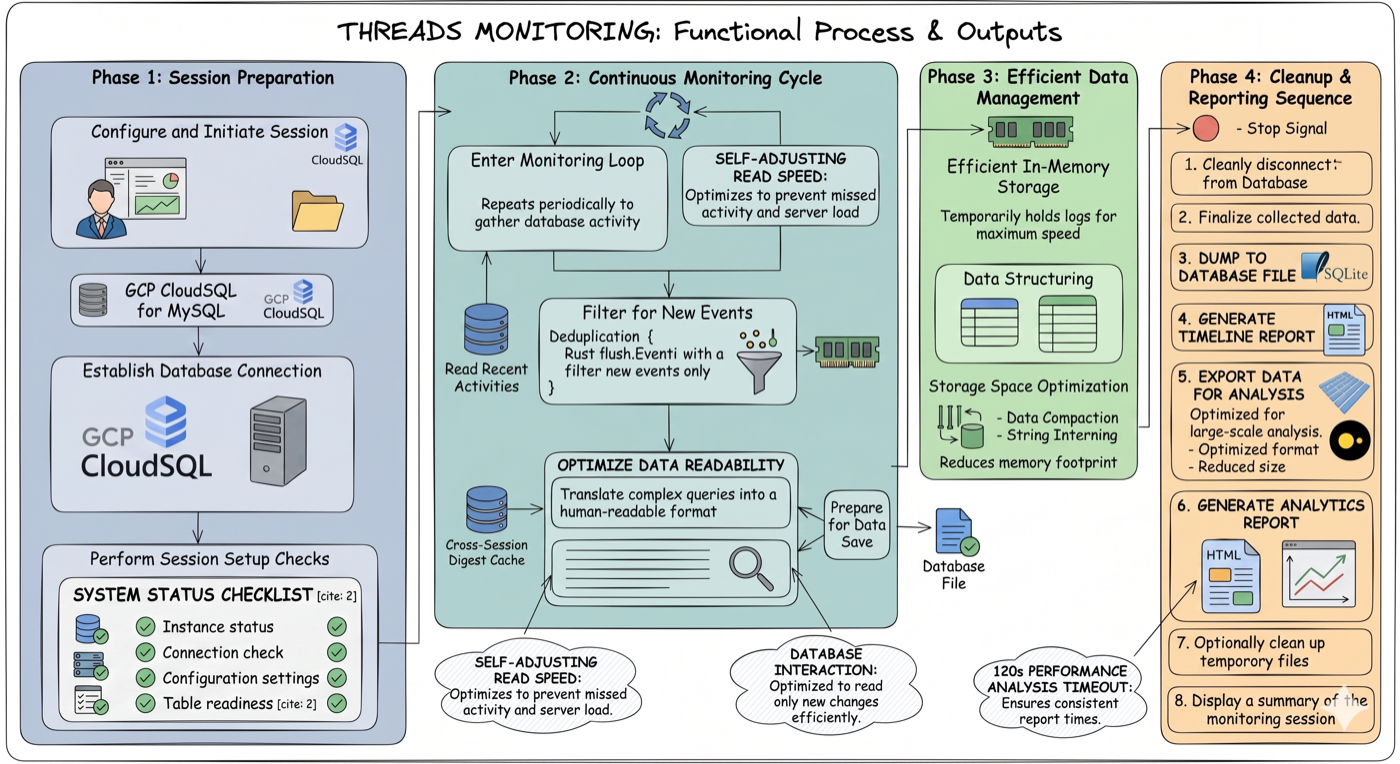
Four phases end-to-end: session preparation (GCP proxy, MySQL connection, health checks) → continuous monitoring cycle (self-adjusting poll loop, deduplication, cross-session digest cache) → efficient in-memory storage (string interning, data compaction) → cleanup and reporting (atomic DB dump, timeline HTML, Parquet export, analytics HTML).
Each poll: fetch new events from events_statements_history_long → deduplicate → batch-resolve digests → write to SQLite. On stop: build indexes, atomic dump to disk, generate both HTML outputs, export Parquet.
GCP Cloud SQL: set gcp_instance in config and the tool spawns and manages cloud-sql-proxy automatically.
Timestamps: derived from MySQL's internal nanosecond timer, calibrated once at startup against wall clock (RTT-corrected). Accurate regardless of poll jitter.
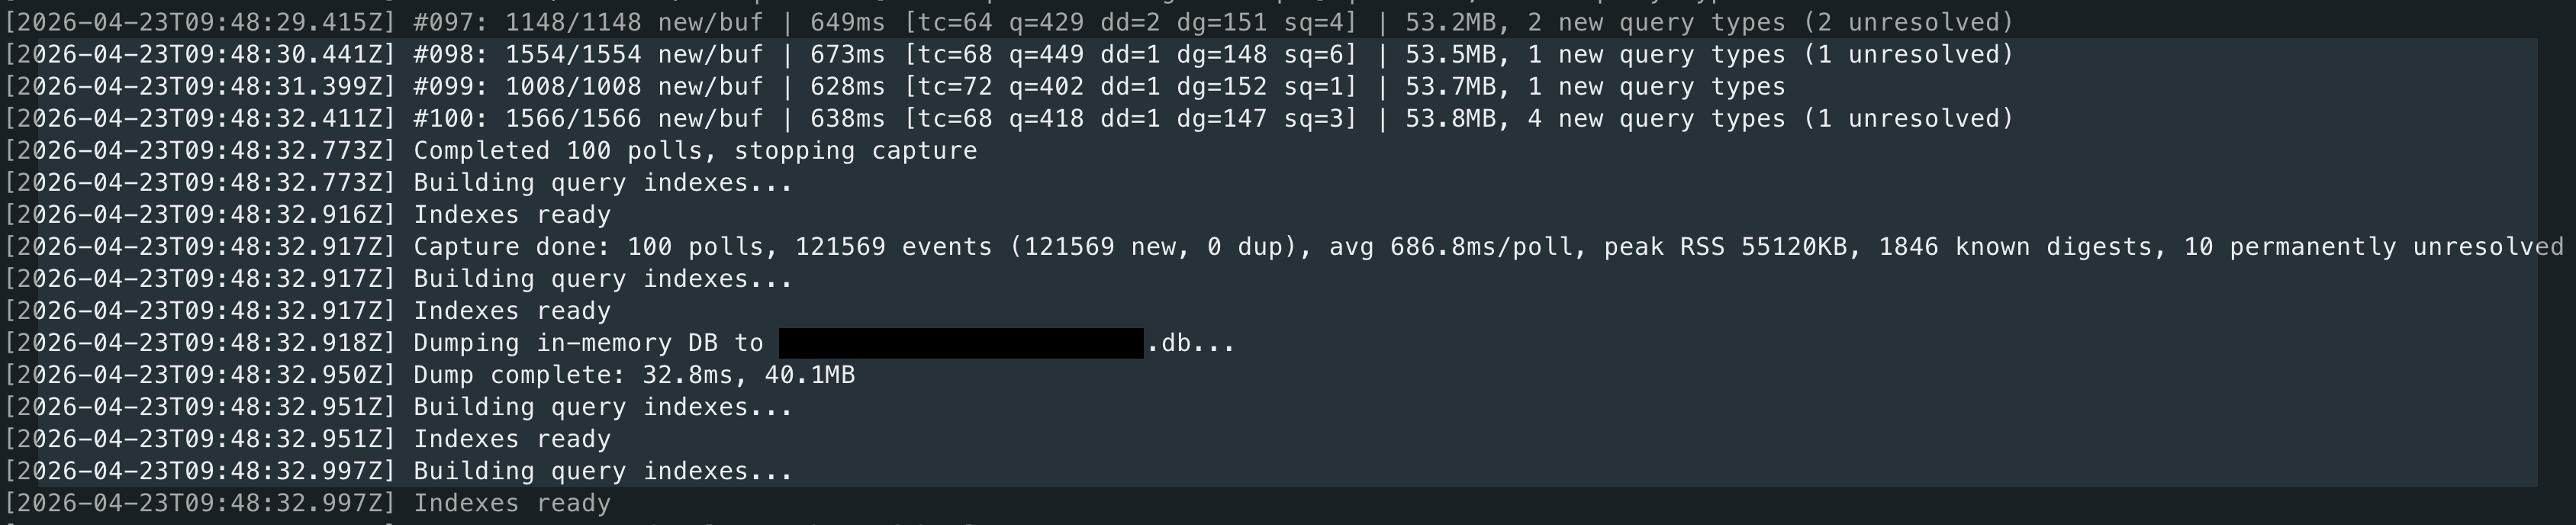
Capture running against a busy production instance. Each line is one poll — format: #<poll> <new>/<buf> new/buf <ms>ms [tc=<threads> q=<queries> ded=<deduped> dp=<digests_pending> sq=<saturated>] <RSS>. Example: #997: 1148/1148 new/buf 849ms [tc=64 q=478 ded=2 dp=151 sq=1] 53.3MB — poll 997 found the ring buffer completely full (1148/1148, sq=1 = saturated), took 849 ms, saw 64 active threads (tc), captured 478 new query events (q), skipped 2 already seen (ded), has 151 digest texts still pending resolution (dp), current process memory 53.3 MB. After Ctrl+C: indexes built, in-memory DB atomically dumped to disk, both HTML reports and Parquet generated automatically.
Notable Implementation Choices
- Single connection — not a pool; one persistent read-only connection keeps server footprint near zero
- Server-side filtering —
TIMER_END > last_high_water_marktransfers only new rows; optionalTIMER_WAITthreshold drops sub-ms noise before it crosses the wire - In-memory SQLite — events accumulate in RAM, indexes built after capture ends, flushed atomically via
VACUUM INTO - String interning — repeated values (
user,host,digest) stored asArc<str>; zero allocation after warmup - Cross-session digest cache —
<instance>.digests.cachepersists query text across runs; digest resolution drops to ~0 ms after the first capture - Self-contained HTML — no server, no CDN, no build step; string-deduplicated JSON payload, events stored as byte arrays (~20× smaller than JS objects)
Output
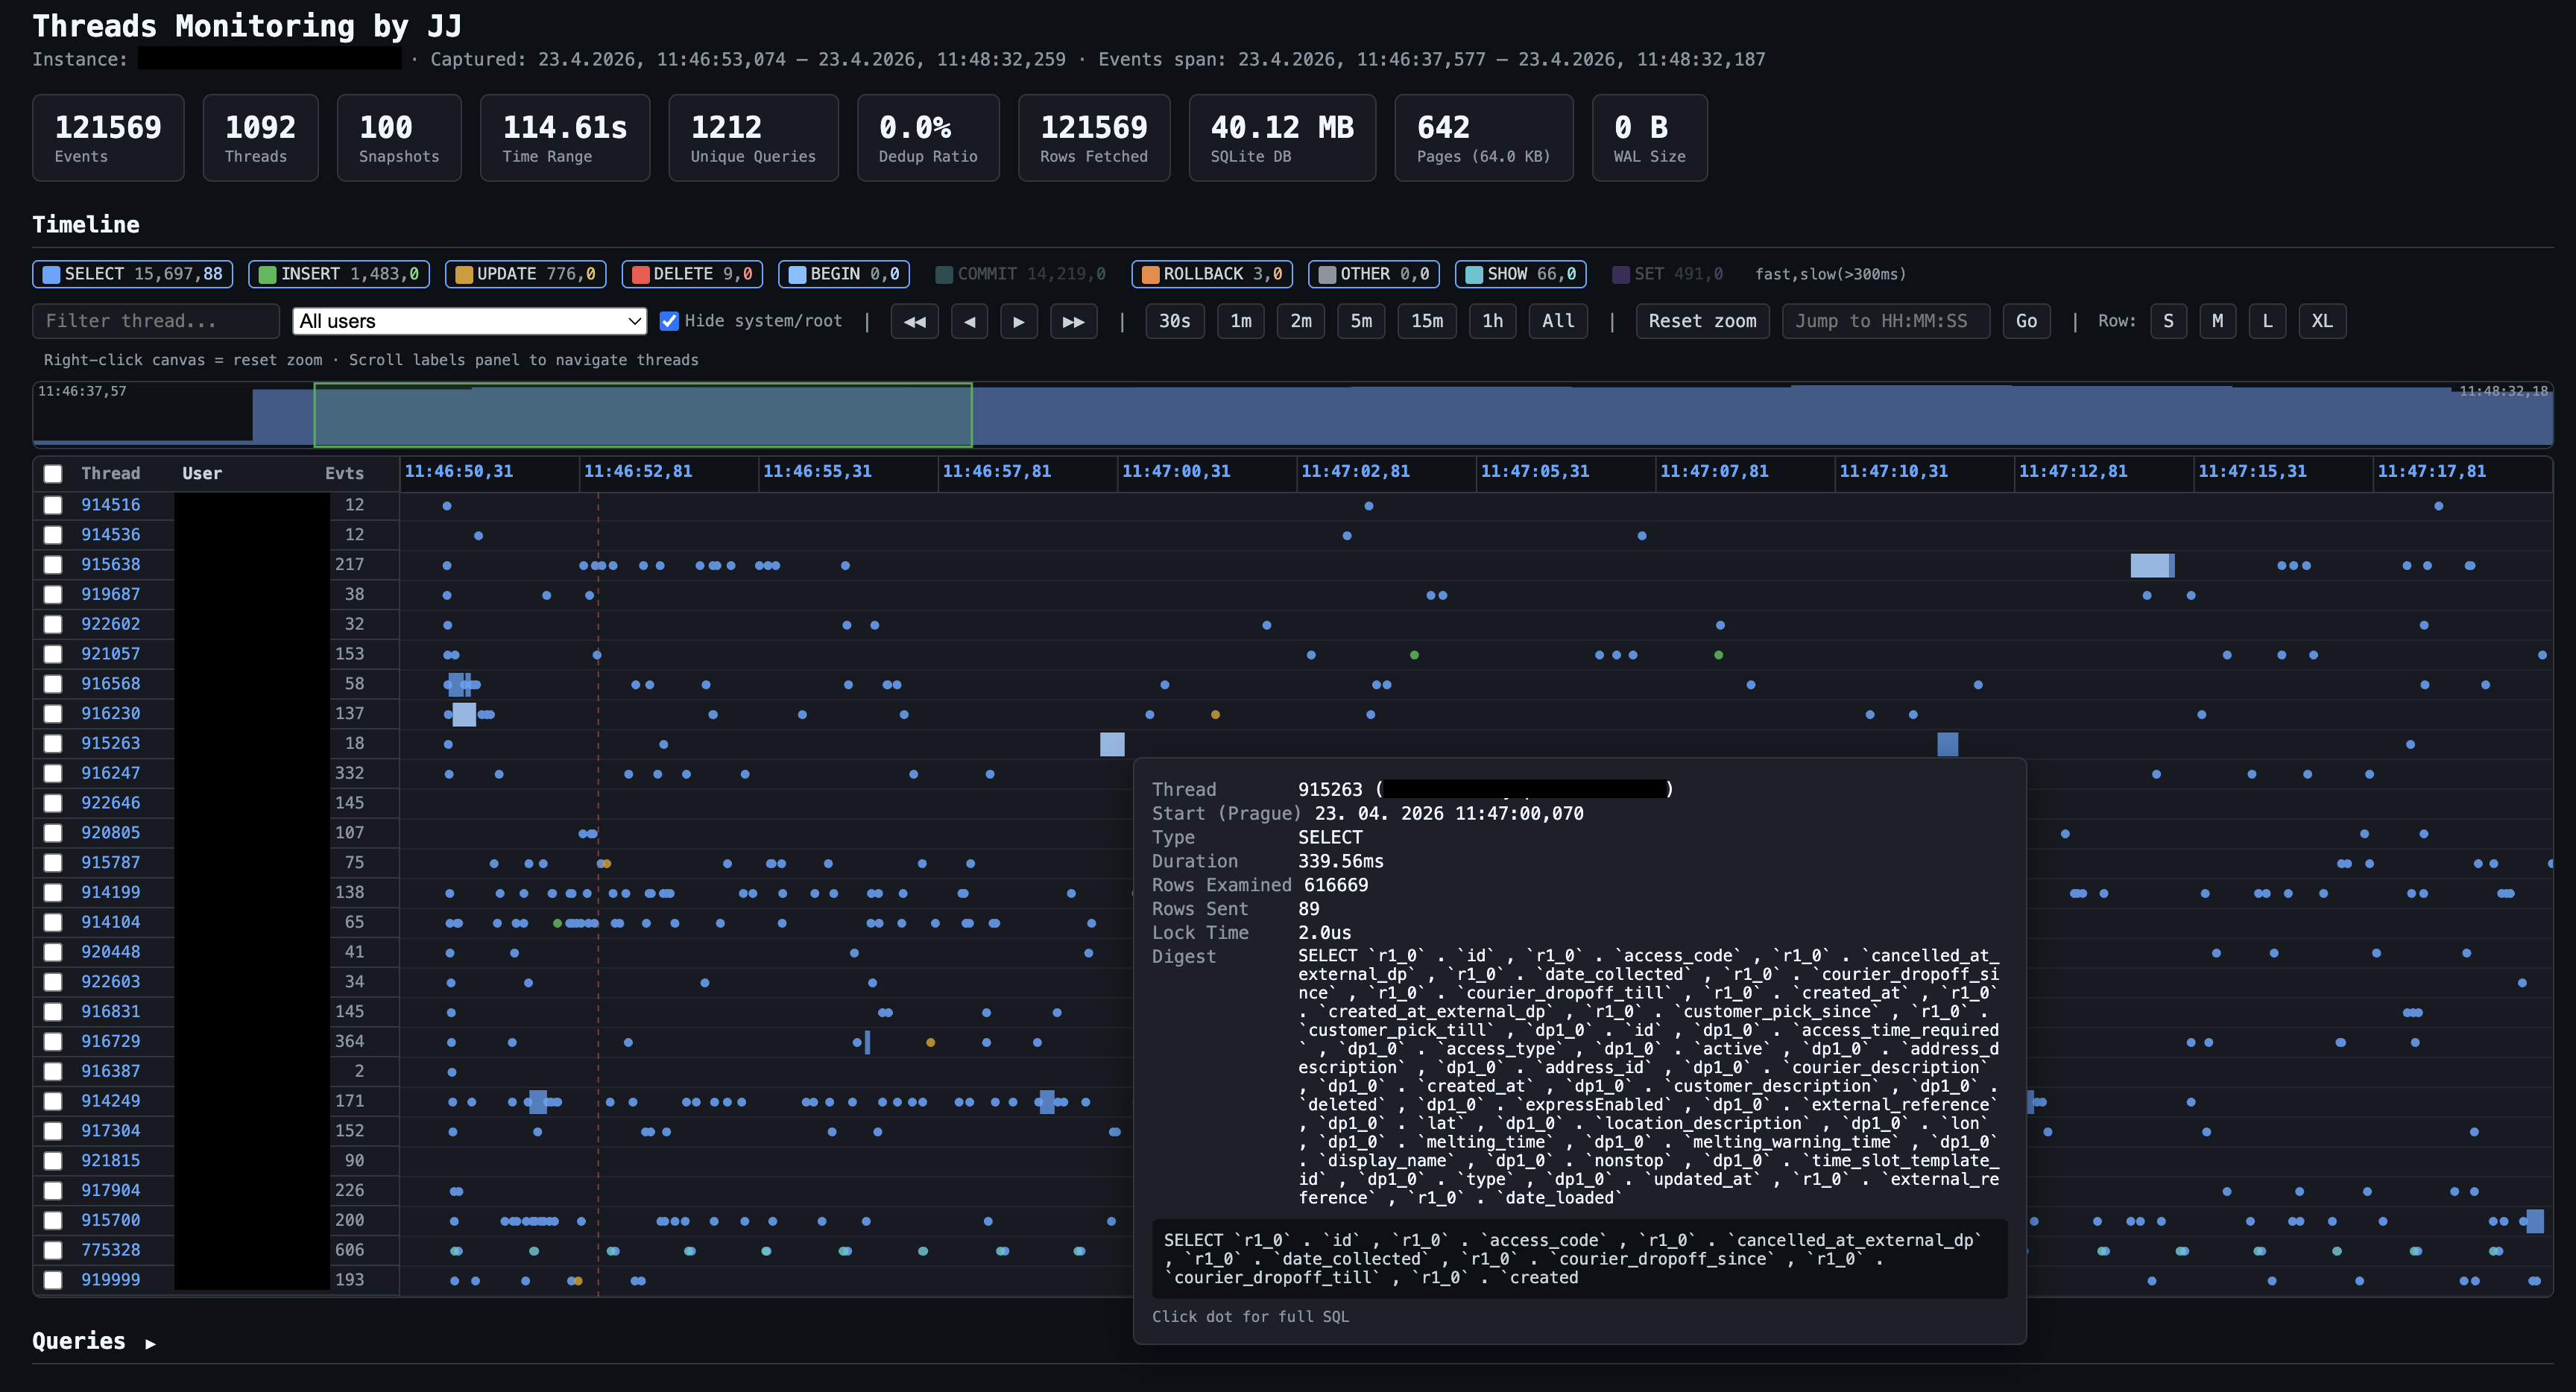
Timeline report from a real capture: 121,569 events, 1,092 threads, 114.6 seconds. Each row is one database thread (ID on the left). Dots are individual query executions, colour-coded by type — the filter bar lets you toggle SELECT, INSERT, UPDATE, DELETE, BEGIN, COMMIT, ROLLBACK, SHOW, SET, CALL, OTHER on/off, or narrow to a specific user. The tooltip on a hovered query shows: thread ID, start time (Prague timezone), duration (230 ms here), rows examined (836,040 — a near-full scan), rows sent (2), and the SQL digest. The minimap above the swimlanes shows global event density across the whole capture.
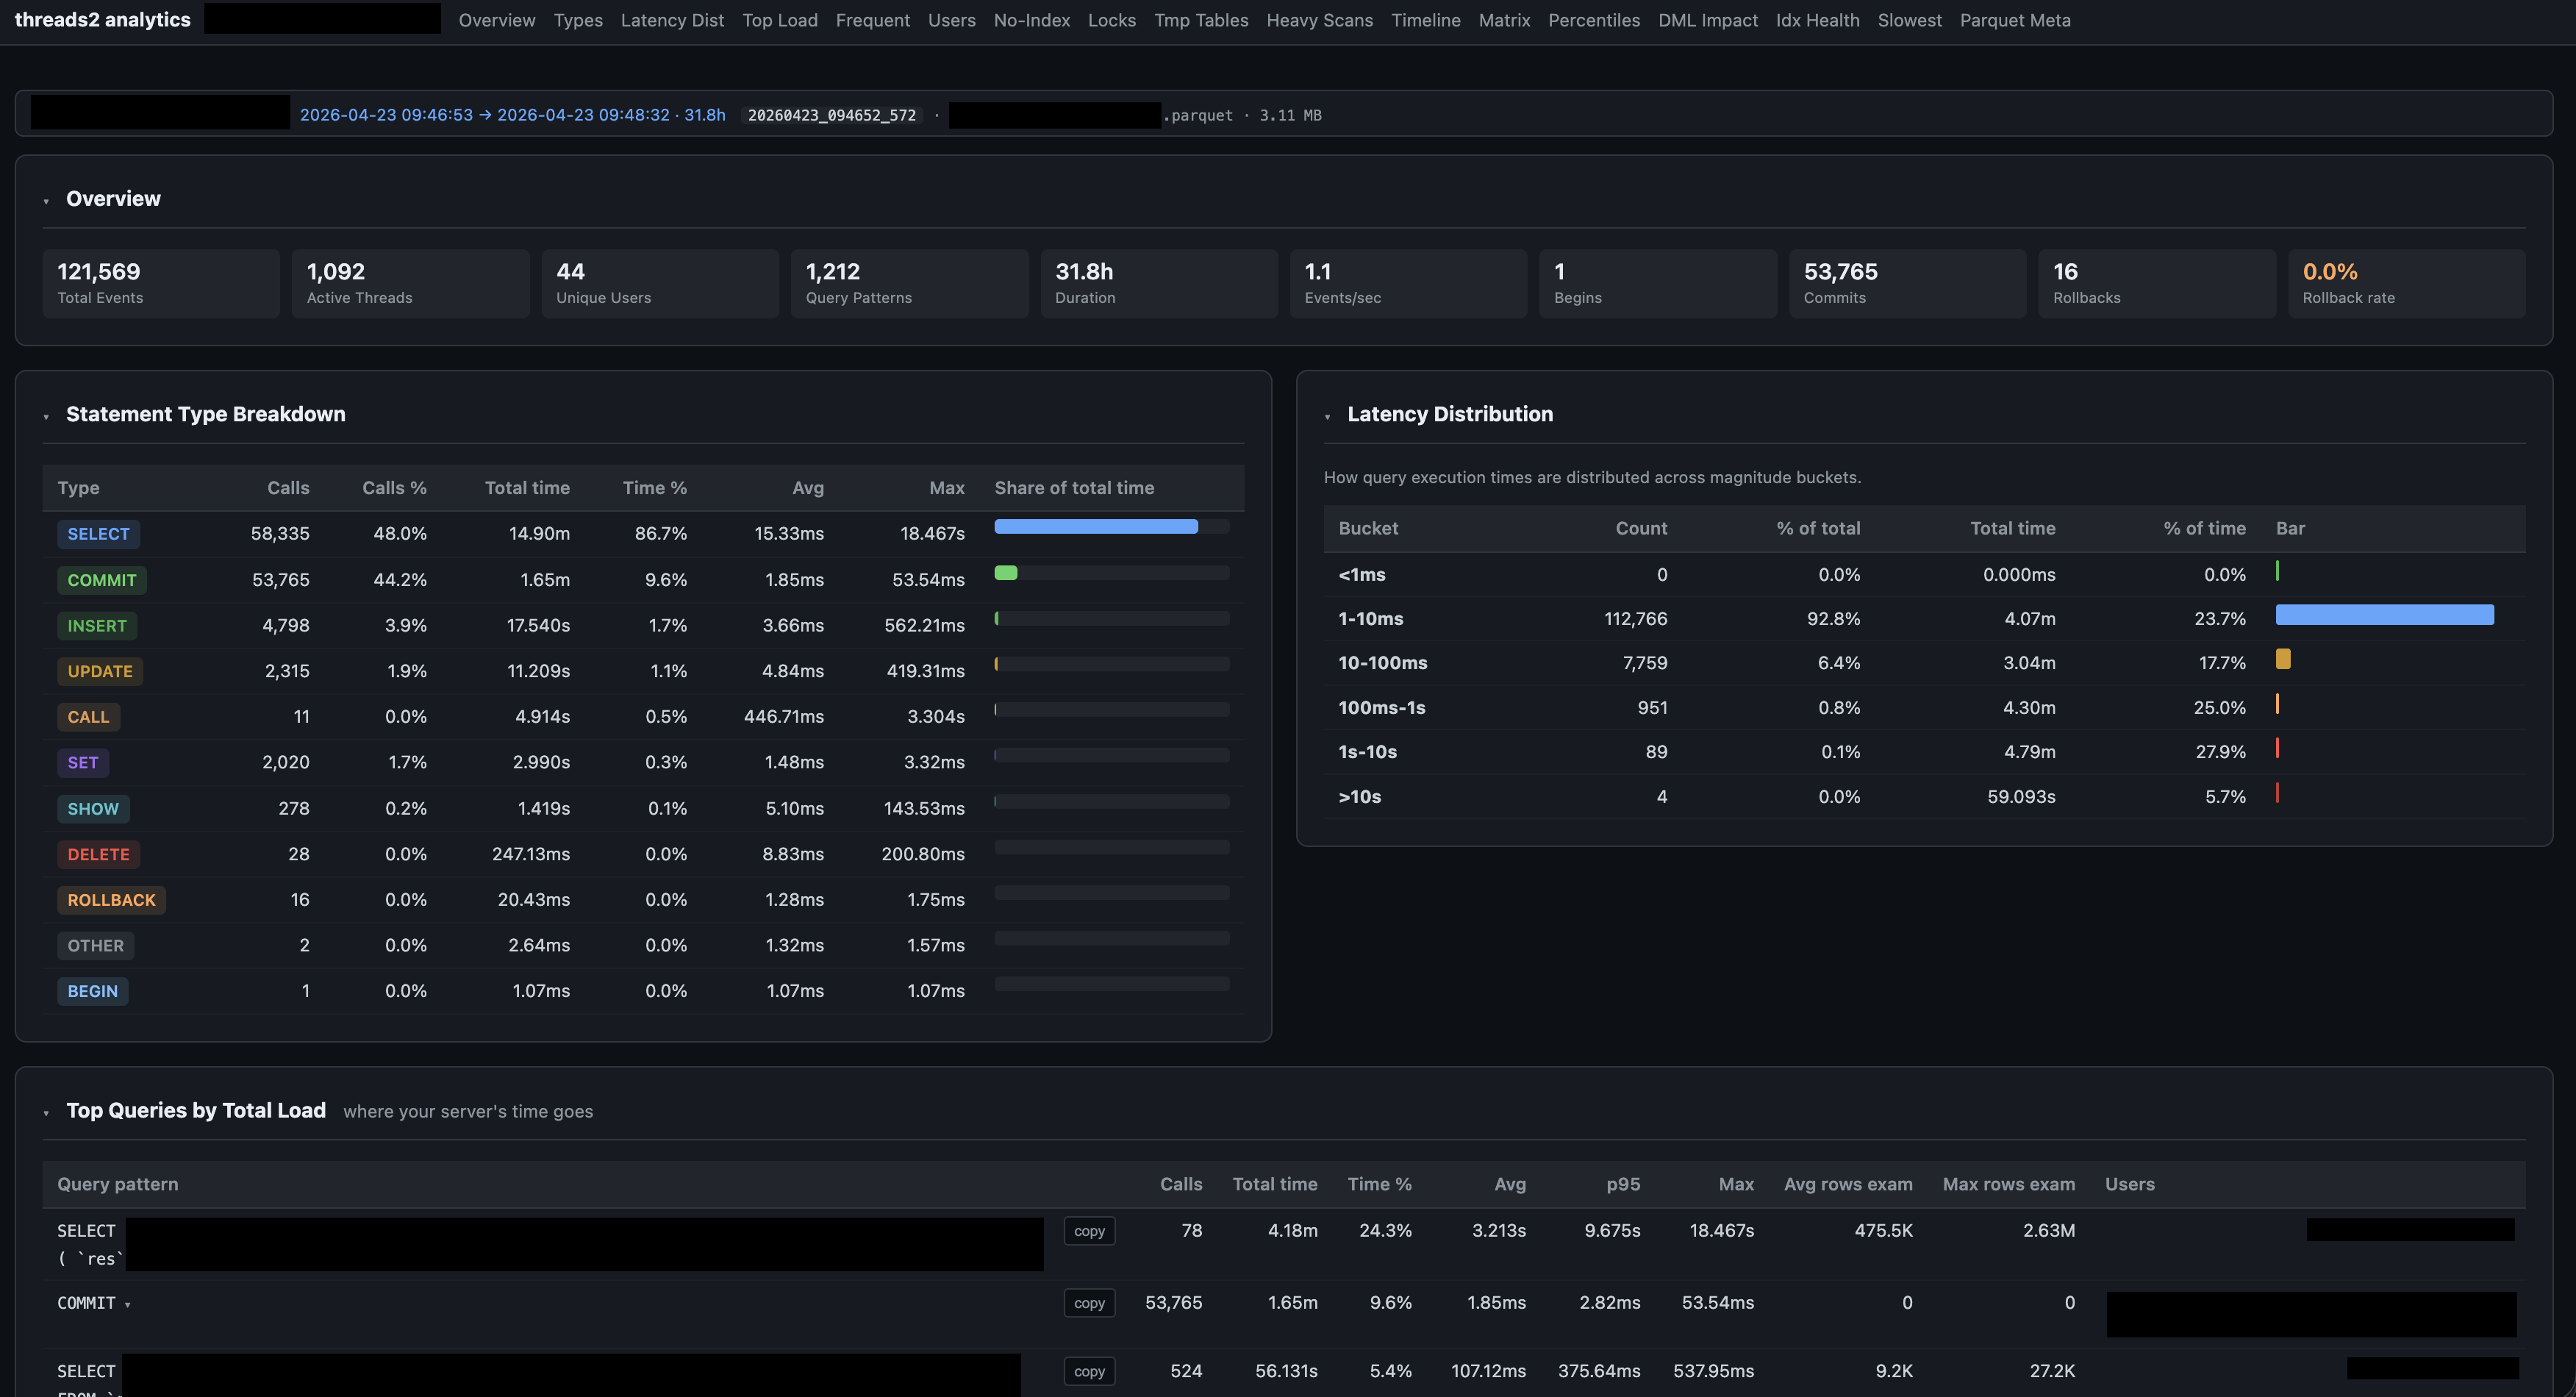
Analytics dashboard for the same session (31.8 h of data, 3.11 MB Parquet). The tab bar navigates 17 sections — abbreviations expanded: Latency Dist = Latency Distribution, No-Index = queries with no index used, Idx Health = index health by user, Parquet Meta = Parquet file metadata. Overview cards show the full session at a glance: 121,569 events, 1,092 threads, 44 unique users, 1,212 distinct query patterns, 53,765 commits, 16 rollbacks. Statement Type Breakdown (bottom left) shows call counts, time share, and avg/max latency per type. Latency Distribution (right) is bucketed by magnitude — here 92.8% of queries completed under 10 ms, with a small tail stretching to 10+ seconds.
CLI
threads2 capture    # Capture live (Ctrl+C to stop)
threads2 dry-run    # Test connection, show performance_schema stats
threads2 report     # Generate timeline HTML from a saved session
threads2 analyze    # Generate analytics HTML from Parquet
threads2 list       # Show all captured sessions
Configuration
mysql:
  gcp_instance: "project:region:instance"
  user: "monitoring_user"
  password_file: "/path/to/password.txt"
  compress: true

capture:
  interval_ms: 2000
  min_timer_wait_us: 1000   # drop sub-1ms events server-side (0 = capture all)
  exclude_self: true

storage:
  in_memory: true
  export_parquet: true
  keep_db: false
  long_query_threshold_ms: 300
Output files (auto-named from instance):
<instance>.html— interactive timeline<instance>.parquet— compressed, queryable via DuckDB / pandas / etc.<instance>-analytics.html— analytics dashboard<instance>.digests.cache— cross-session digest cache
Tech Stack
| Component | Technology |
|---|---|
| Language | Rust — async via Tokio |
| MySQL driver | mysql_async — binary protocol, pure-Rust TLS |
| Storage | SQLite (bundled) → Parquet via DuckDB (bundled) |
| Output | Self-contained HTML + ZSTD Parquet |