
Less Noise, More Signal: Our Small AI Experiment Meets Monitoring
A few weeks ago two of our engineers described putting the Boy Scout Rule on a schedule — an AI agent that opens a small refactor every workday. We took the same shape and pointed it somewhere messier: our production monitoring. Here's the Datadog auto-fix playbook, the fixes it actually lands, and why we review these far more carefully than the code ones.
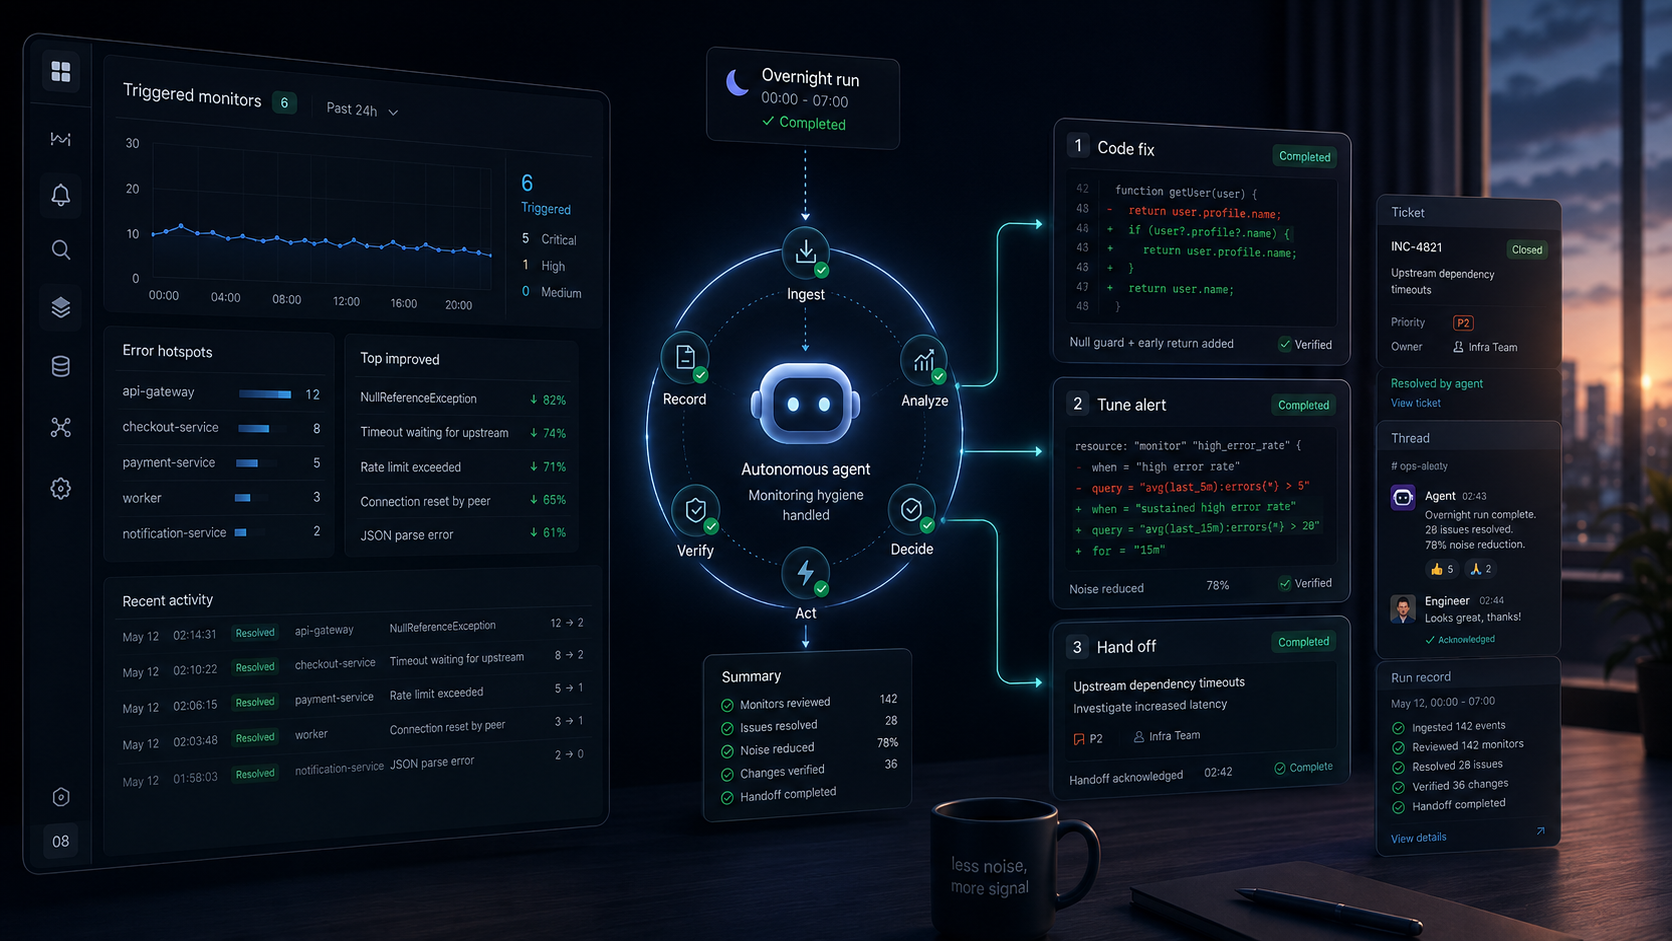
A few weeks ago Maroš and Filip described what happens when you put the Boy Scout Rule on a cron schedule: an AI agent that opens one small refactoring merge request against our codebase every workday, with the safeguards that make it safe to leave running. If you haven't read Tiny Refactor a Day, it's the better starting point — this post is the sequel.
Because once that loop was working, the obvious question was: what else has this shape? Small, repetitive, easy-to-defer maintenance that never wins a sprint. The answer we kept landing on wasn't in the code at all — it was in our monitoring. The errors we log and the alerts we wire up, and then stop reading. So we took the same playbook-on-a-schedule idea and pointed it at Datadog. Now, before the team logs on, an agent has gone through yesterday's production errors and triggered alerts and done something about each one.
The same shape, a messier target
For anyone who skipped the first post: the pattern is a playbook — a written procedure the agent follows — attached to a schedule that runs it unattended, with a backlog guard that makes it skip a run when too many of its merge requests are still waiting for review. The code version reads source, finds a duplicated block or a method doing two things, and opens a small MR.
Monitoring needs a different opening move, because there's nothing to "find" by reading source. Each morning the Datadog playbook instead pulls the last 24 hours of triggered monitors and the noisiest error hotspots across the team's services — ignoring a per-service list of known-benign errors and anything below a minimum daily volume — and then does the thing the code playbook never has to. It decides what the error actually is.
That triage is the whole game, and it lands in one of three buckets:
- A real bug → a code fix, opened as a merge request in the service repo like any other.
- Noise working as designed → the log level gets lowered, or the monitor's threshold tuned. Monitor changes are made as code — a diff against our Datadog monitoring-as-code in Terraform, with a written justification for why the alert was firing on nothing.
- An infrastructure or upstream problem the agent can't fix → a ticket with the evidence attached, handed to the team that owns it.
Every run ends the same way: a Linear ticket as the record, and a reply posted straight into the alert's own Slack thread, so whoever looks next already knows what happened. Code fixes and monitor changes even carry separate labels and separate backlog guards, so a pile-up of one never stalls the other.
Put next to the code playbook from the first post, most of it is untouched — the schedule, the backlog guard, the Linear issue as the record. What we added on top of it is short:
- A new opening move — instead of reading source for a refactor candidate, pull the last 24 hours of triggered monitors and the noisiest error hotspots, minus a per-service benign list and anything below a minimum daily volume.
- A triage-and-route step — classify each error as a real bug, noise working as designed, or an infra/upstream problem, and send it down the matching track.
- Per-track backlog guards — separate labels and separate guards for code fixes and monitor changes, rather than the single guard the code playbook runs.
- A Slack close — every run posts its outcome back into the alert's own thread.
What it actually finds
After a few weeks across two of our teams, the fixes fall into a handful of recognizable shapes — roughly in order of how often they show up:
- Turning down expected noise. The biggest bucket by far: an already-handled case still logged at ERROR or WARN, dropped to the level it should have had. One of these quieted a stream logging ~790 lines a day; another, a run of client disconnects on a live event feed, ~570 a day. Nothing was broken — the logs just insisted otherwise.
- Guarding against bad input. Null and validation guards that stop high-volume spam at the source: a missing null-name guard (~74 errors/day), empty image URLs hitting a downstream call (~99/day), an unbounded budget value that threw a 500 where a 400 belonged.
- Real data bugs the noise was hiding. Not every loud error is benign. One recurring
LazyInitializationException— ~880 a day in a nightly campaign job — was a missing fetch-join; a numeric column too small for its values was silently blanking a customer's dashboard. - Tuning the monitors themselves. Over-sensitive alerts fixed at the source: a database probe query firing ~1,000 times a day, a set of job monitors throwing false positives after a service was split across pods, an SLO latency threshold corrected — each as a reviewed Terraform change, never a click in the UI.
- Hardening how we read the outside world. A cluster of failures parsing LLM and third-party JSON responses (~160–240/day each), fixed with more defensive deserialization.
The ones it can't fix — a dependency misrouting millions of requests a day, an upstream returning a zero price — it doesn't pretend to. It writes up the evidence and hands them off.
One that really made the case
Here's the merge request that best captures why this is worth doing. It is, deliberately, unspectacular.
One of our product-data services enriches products with AI-generated brand and manufacturer descriptions, using a web-search API and an LLM. It had been logging around 74 errors a day, all variations on one theme: "Error performing search for 'null'", "Failed to generate brand description for 'null'." When a product arrived without a brand or manufacturer name — an everyday case in a grocery catalogue, where loose produce, bakery and deli items sold by weight, and unbranded basics often carry no brand at all, and the manufacturer field is emptier still, unset for private-label lines and anything sourced without a named maker — the code didn't stop. It called the web-search API with the literal string null as the query, got a 400 back, logged an ERROR, then called the LLM with the same null and logged another. Two failed external API calls and two ERROR lines for every null-named product — roughly 74 needless calls a day, for a case the code already knew how to handle.
The agent traced it from the error logs, confirmed the null path was expected, and added blank-name guards at the entry points: skip the external calls, return empty, log at WARN. Not a monitor tweak at all — a genuine code fix that happened to surface through the noise.
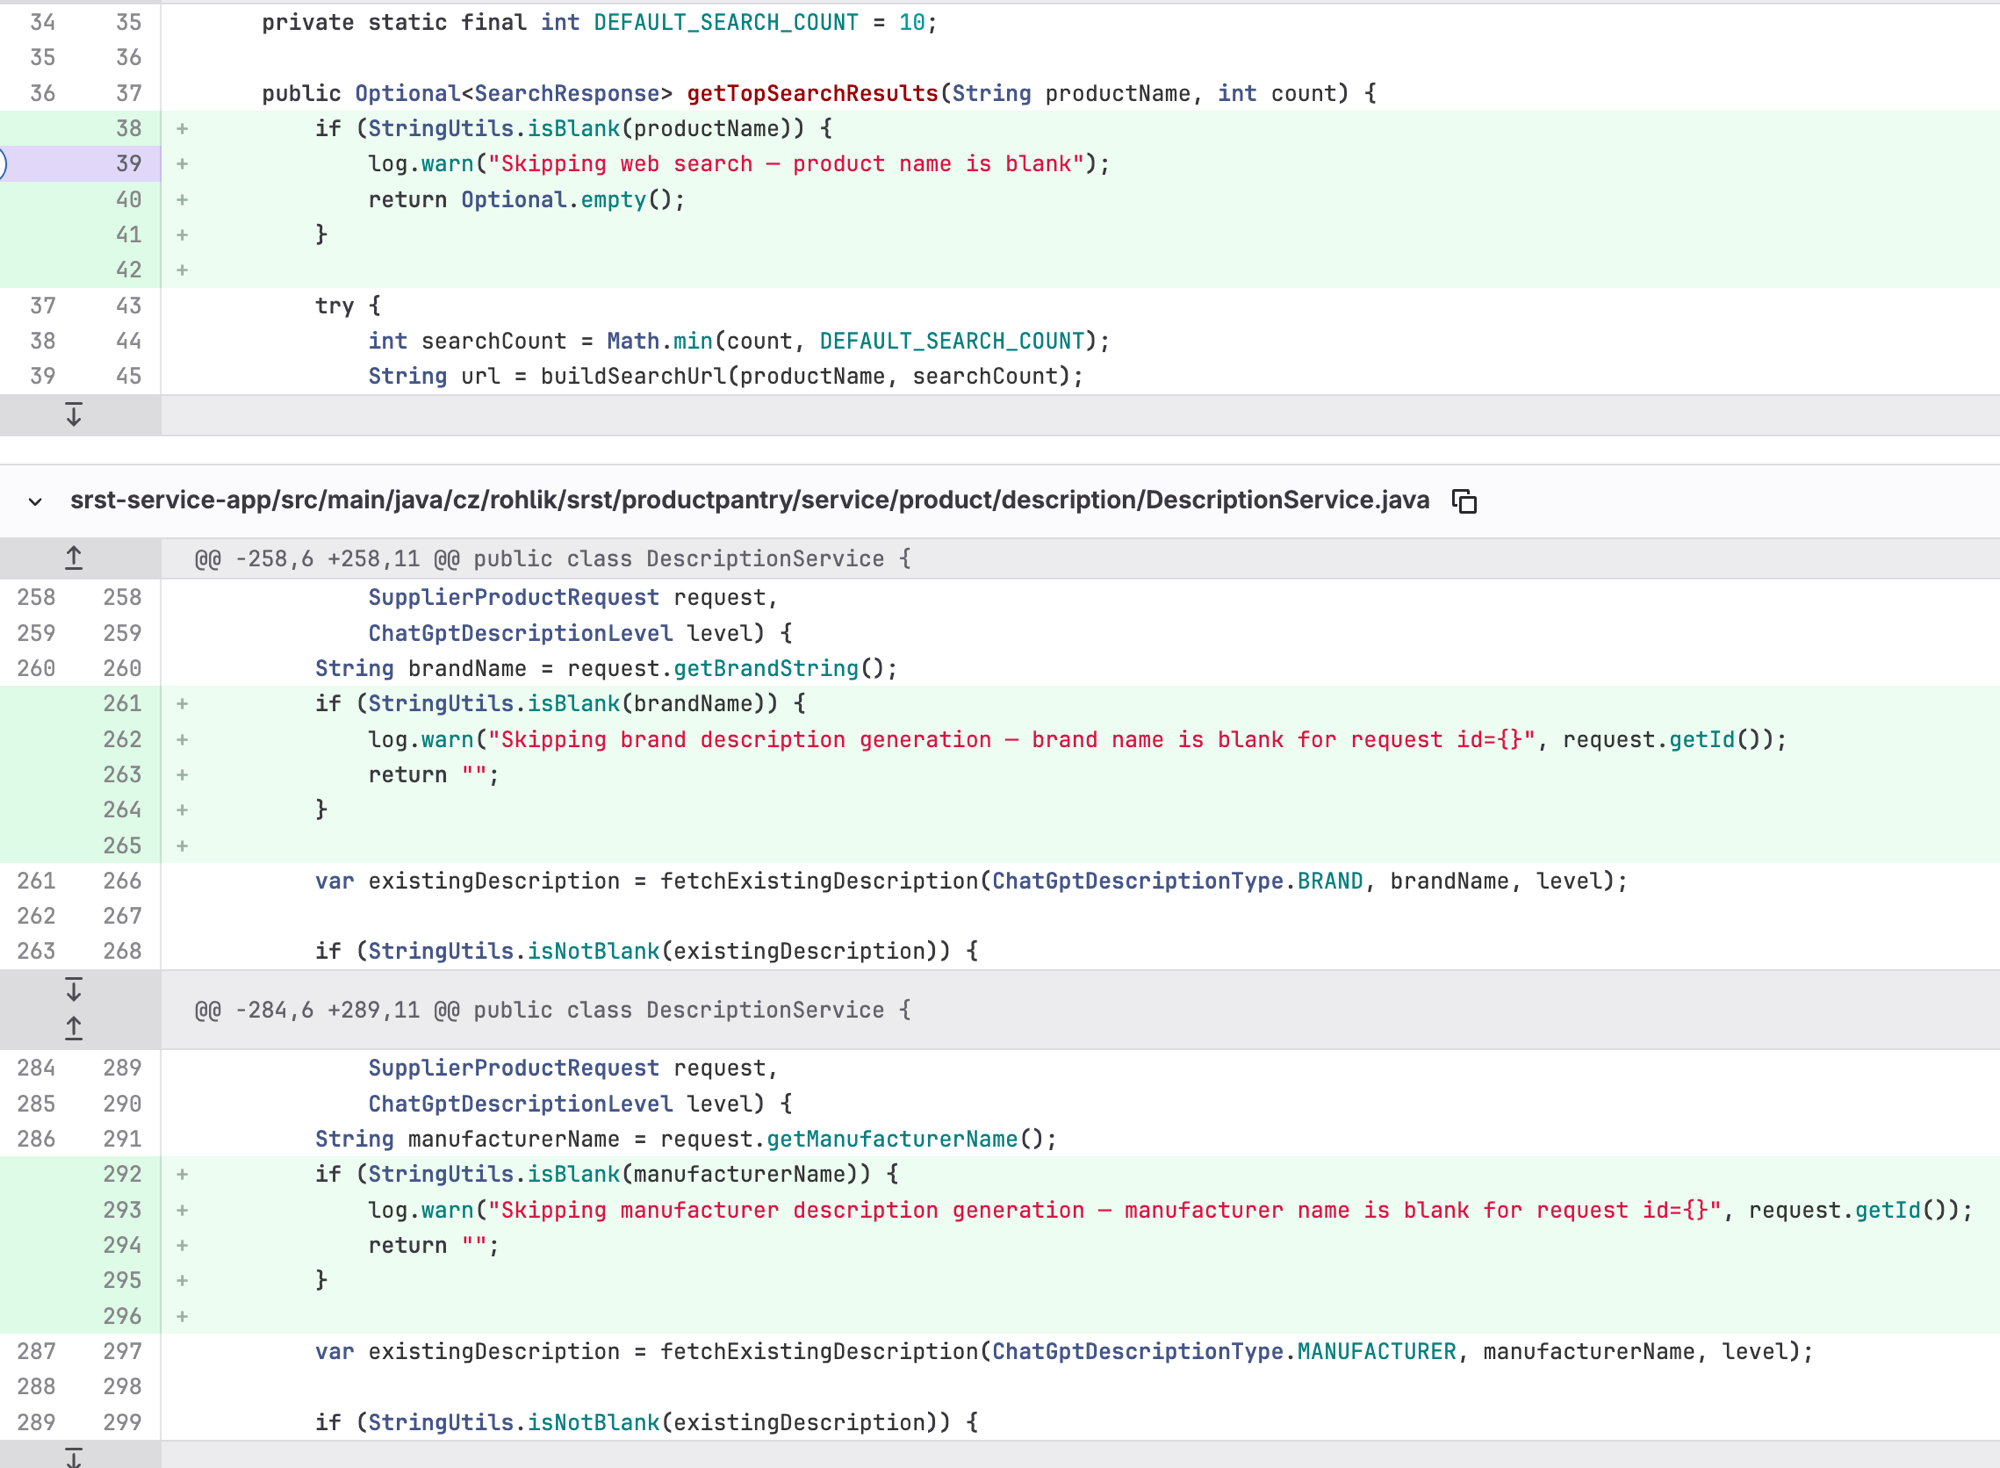
The actual fix — a blank-name guard that short-circuits the null case before it ever reaches the web-search or LLM calls.
Two wins from one tiny diff: about 74 ERROR lines a day gone from the service's error tracking, and about 74 wasted external calls a day — with their cost and latency — gone with them. Nobody would ever have put "stop searching for the string null" on a roadmap. It's exactly the kind of thing that sits in the logs for a year.
The merge rate — lower here, and that's the point
In the first post the merge ratio was the headline number, and we track the very same thing here: the share of the agent's merge requests a human reads and merges. On the code side, one of our teams now runs at around 94% — up from the ~80% the first post reported across the whole schedule. On the monitoring side it sits around 70% — clearly lower. Rather than give that number a softer name, we keep calling it the merge rate and let the gap speak, because the gap is the finding, not a disappointment.
The same number just has to be read differently on each side. A refactor is bounded and reversible, so there a lower merge rate would only mean friction. A monitoring change reaches toward production behaviour: quiet the wrong log line and you hide a real failure; loosen the wrong threshold and you blind a real alert. So each one earns a harder look, and a merge rate around 70% is the review gate working, not failing — the roughly three-in-ten we don't merge are reviewers doing exactly their job, catching a downgrade that was covering something real, or a threshold relaxed a shade too far. The rule holds across both halves of the experiment: the closer a change gets to production, the more human judgement it earns.
That difference is also steering where we go next. For the small code improvements — bounded, reversible, merged ~94% of the time — we're now piloting a hands-off skill that lets the agent open, verify, and merge on its own. We are not there for monitoring, and we're honest that we won't be for a while: a wrong call is too easy and too quiet. So the split is intentional for now — hands-off where it's safe, careful review where it isn't. But we treat a fully autonomous loop as the direction of travel, not a fantasy. Until we trust it here, we review these changes cautiously and experiment aggressively at the boundary. Tellingly, the one incident serious enough for Maroš and Filip to write up came from the code track — the immutable-list bug in the first post — not from monitoring, which hasn't caused a production incident so far. That record is what lets us keep moving the line.
The tax of speed comes due in two places: the code we write, and the monitoring we wrap around it. Both used to be paid late and grudgingly, out of whatever attention survived to the end of a sprint. Now an agent pays a little of it every morning — a guarded null, a quieter log line, a tuned threshold — and hands us back the calls that actually need a person. The boring half runs on a schedule; we get to spend our attention on the half that doesn't.